
Your Dashboard gives you a quick snapshot of how your shop is performing. Track visitors, orders, conversion, average order value, and net revenue, compare performance over time, and see which products and categories are bringing in the most sales.
Use the date range controls to focus on the time period you want to review. Your selected date range applies across your Dashboard, including Top Products and Top Categories.
Understanding the Dashboard
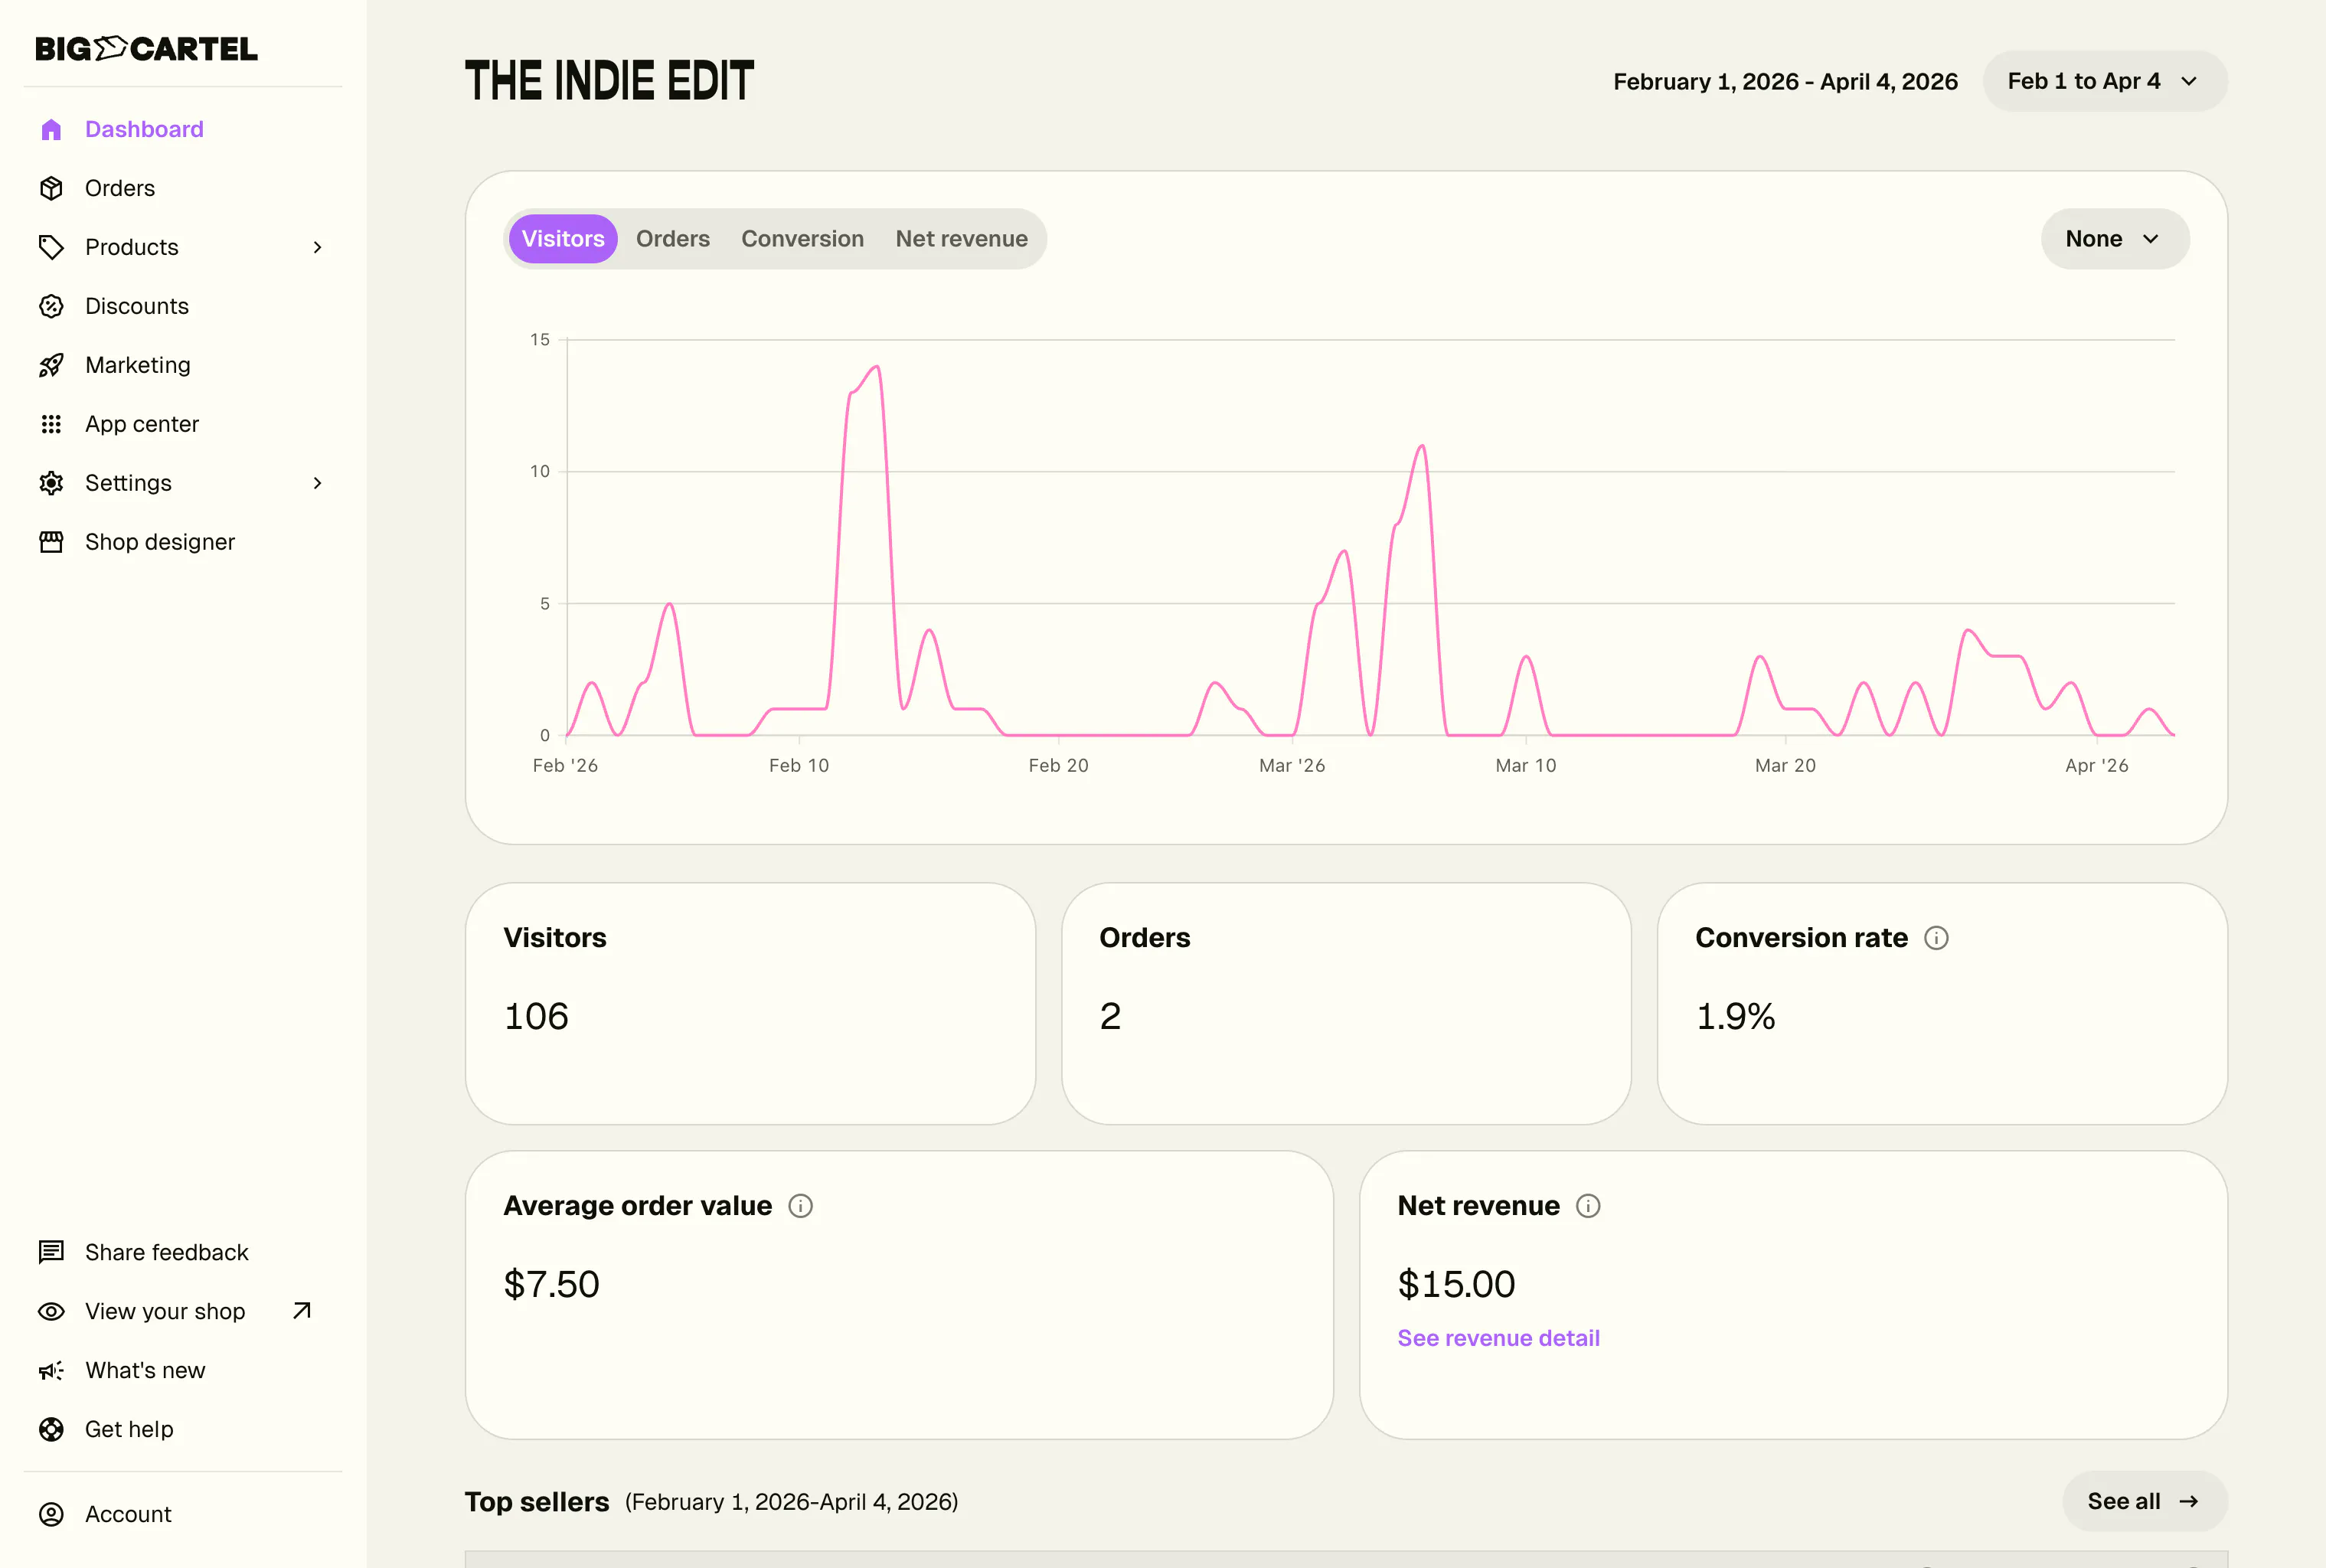
The graph at the top of your Dashboard shows how your shop performed over the selected date range.
Use it alongside the Visitors, Orders, Conversion, and Net revenue cards to spot changes in traffic and sales and understand how your shop is performing over time.
You can also compare your selected date range with the previous period. Comparisons are shown by default and automatically match the length of the date range you've selected.
When comparing periods:
- Each Dashboard metric shows how it changed compared with the previous period.
- The graph displays the previous period alongside your current results, making it easier to spot changes and trends.
Visitors
The Visitors card shows how many visits your shop received during the selected date range.
This includes both new and returning visitors, helping you understand how much traffic your shop is getting.
Note: Visitors aren't tracked while your shop is in maintenance mode since shoppers can't access your storefront.
Orders
The Orders card shows how many orders were placed during the selected date range.
Cancelled orders are excluded from your order total, giving you a more accurate picture of your shop's sales activity.
Conversion
The Conversion card shows the percentage of visitors who placed an order.
Your conversion rate is calculated by dividing the number of orders by the number of visitors. Looking at conversion alongside your visitor and order totals can help you understand whether more shop traffic is turning into sales.
Average order value
The Average order value card shows the average amount customers spend per order during the selected date range.
Looking at your average order value alongside your order and revenue totals can help you understand how much customers typically spend when they shop with you.
Net revenue
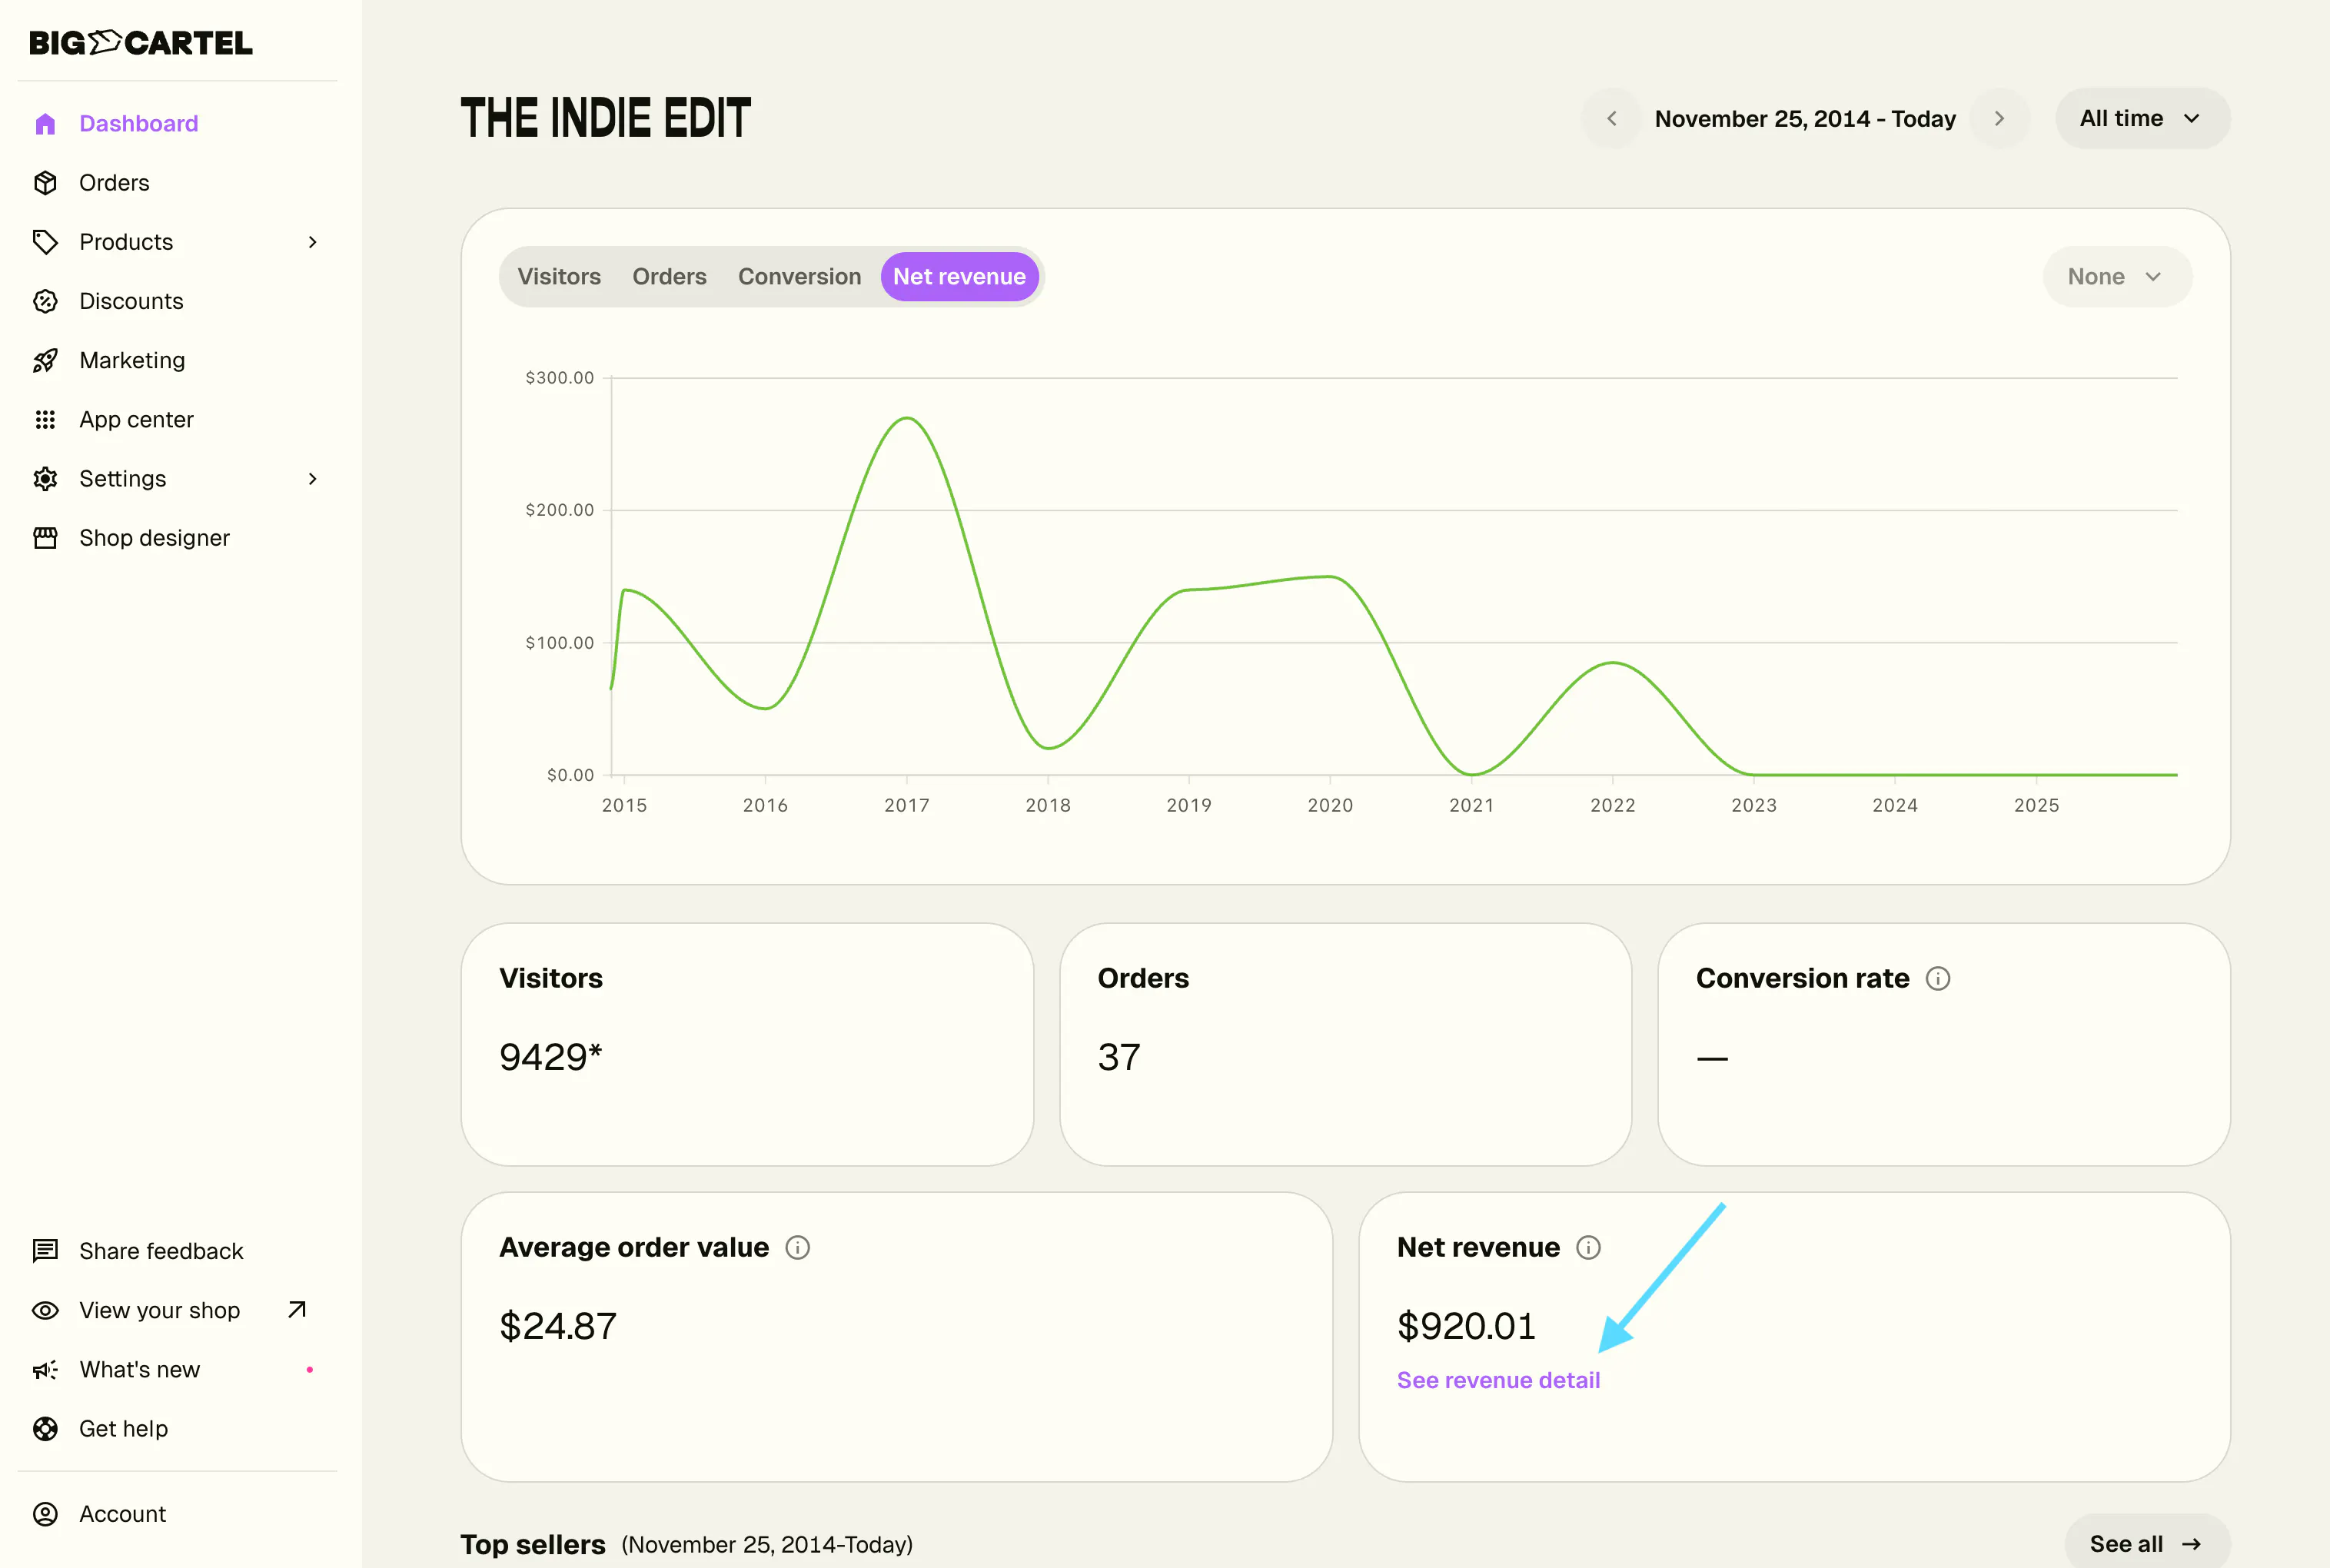
Net revenue shows how much your shop earned from product sales after discounts and refunds, excluding shipping and taxes.
The Net revenue card gives you a clearer picture of the revenue generated by your shop.
Net revenue:
- Subtracts refunds on the day they're processed
- Subtracts order discounts
- Excludes taxes
- Excludes shipping charges
- Excludes cancelled orders
This means a refund will affect your revenue on the date the refund is processed, even if the original order was placed during an earlier period.
You can hover over the Net revenue card for a reminder of how the total is calculated.
View your revenue breakdown
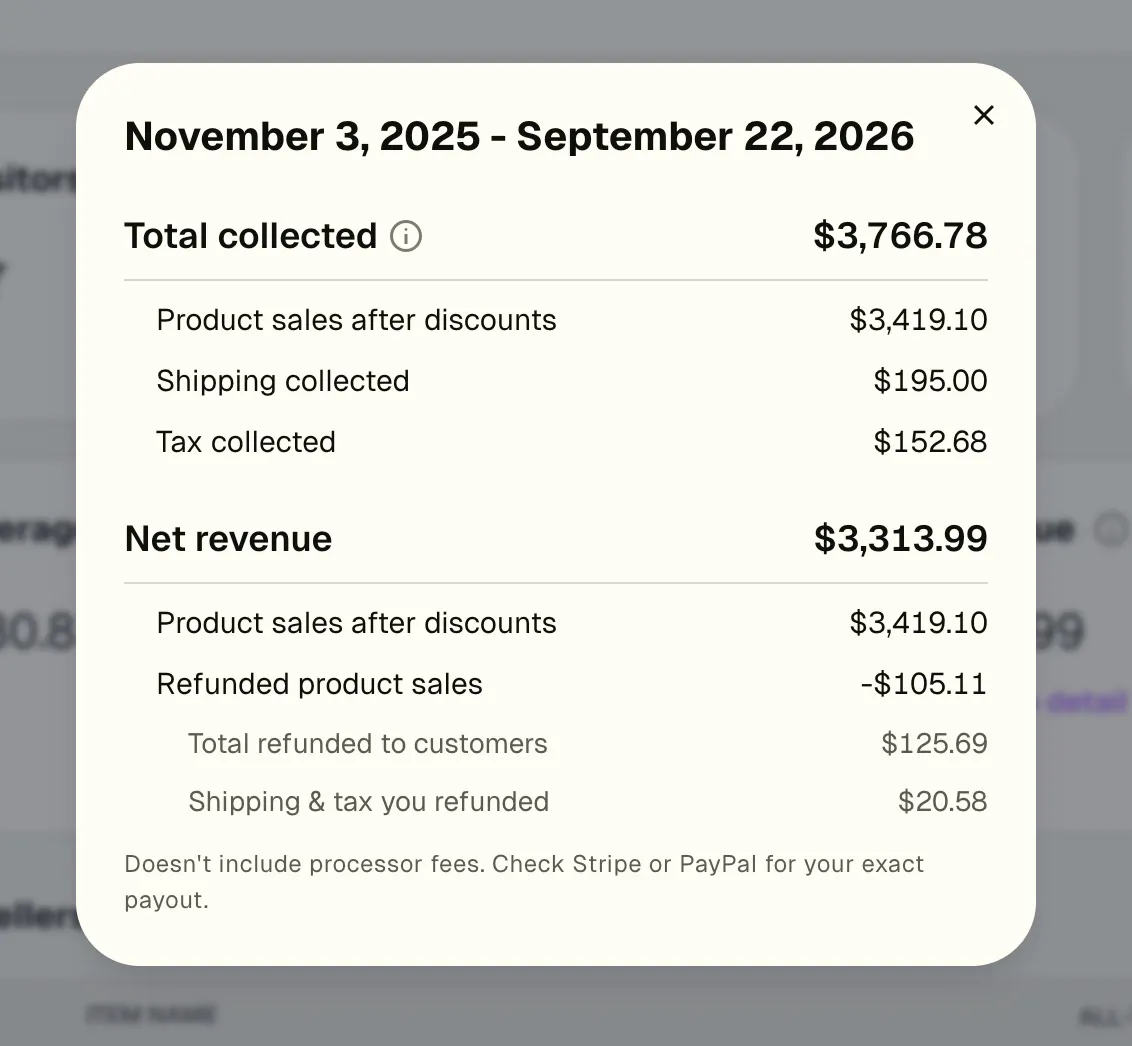
Click See revenue detail in the Net revenue card to see a detailed breakdown of your shop's revenue for the selected date range.
The revenue details panel includes two sections:
Total collected
Total collected shows the full amount customers paid during the selected date range, including:
- Product sales after discounts
- Shipping collected
- Tax collected
This gives you a clearer picture of how much money came into your shop before refunds and payment processor fees.
Shops selling in multiple currencies
If you've accepted orders in more than one currency, revenue for each currency is displayed separately.
Big Cartel doesn't convert currencies or combine them into a single total, so you can see the actual amount collected in each currency.
Top Products and Top Categories
Scroll down your Dashboard to see which products and categories are performing best.
Top Products and Top Categories follow the same date range you've selected for the rest of your Dashboard, so changing your date range updates these results too.
Revenue shown here is gross revenue, while the main Dashboard card displays Net revenue. Because they're calculated differently, the revenue shown for your products and categories won't necessarily add up to your Net revenue total.
You can use these stats to identify what's selling well, what may be worth restocking or promoting, and how different parts of your catalog perform over time.
Export order data
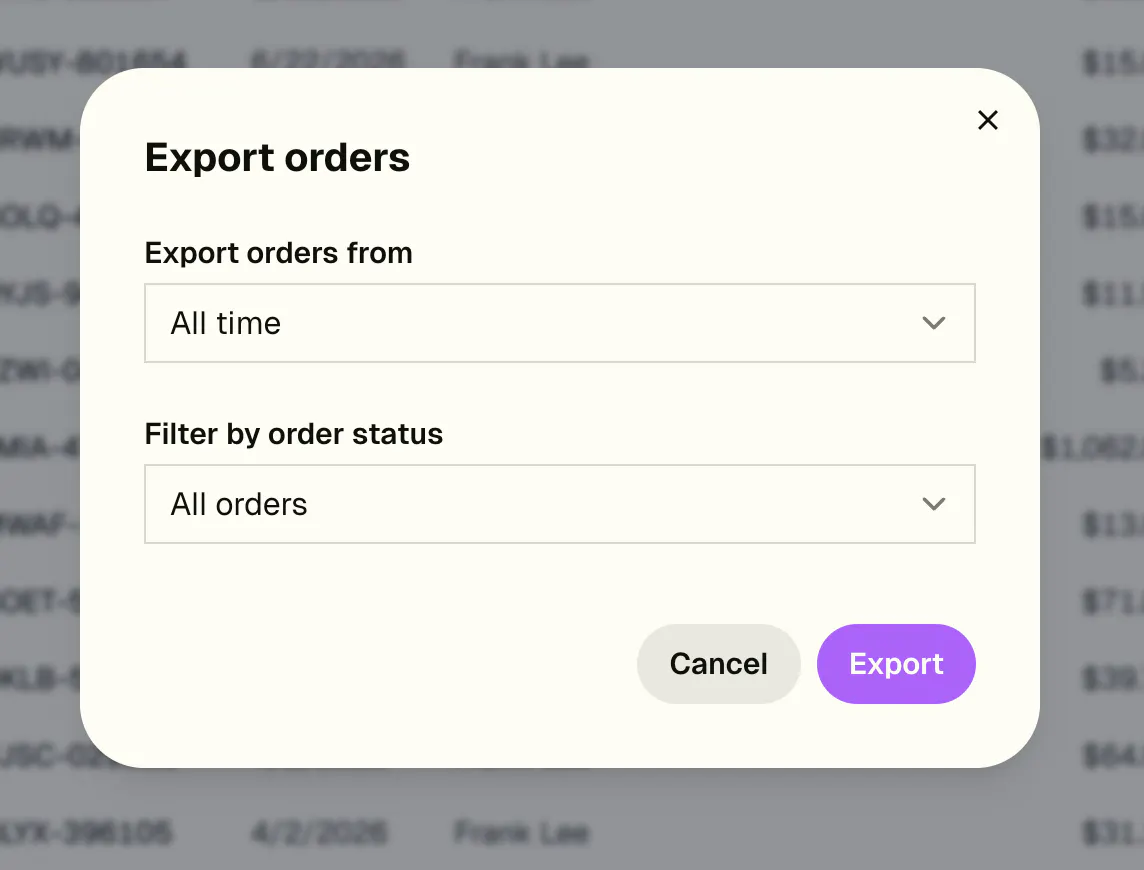
Need a closer look at your sales or want to share your order data with an accountant? You can export your orders as a CSV file from the Orders page.
When you open the order export, All time and All orders are selected by default. If you want to export all your orders, simply click Export to download your CSV file.
You can also narrow your export by selecting a specific date range or order status.
Date range
Choose from the following date ranges:
- All time
- Last 7 days
- Last 30 days
- Current month
- Current year
- Previous year
Order status
Filter your export by order status to download only the orders you want to review.
You can also select Cancelled to export cancelled orders separately from your other orders.
Your export includes both the order date and refund date, so you can sort or analyze your data based on when an order was placed or when a refund was processed.
CSV files can be opened and sorted in spreadsheet tools like Excel, Numbers, or Google Sheets.
Using your stats
Looking at your Dashboard regularly can help you understand what's changing in your shop and measure the impact of things like product launches, promotions, or marketing campaigns.
For example, you can use your stats to answer questions like:
- Are more people visiting my shop?
- Are visitors turning into customers?
- How much are customers spending per order?
- Did a recent promotion increase orders or revenue?
- Which products or categories are bringing in the most sales?
- How much money did my shop collect, and how much did I earn from product sales?
- Is my net revenue increasing compared with the previous period?
Looking at these metrics together — and comparing them over time — can give you a more complete picture of how your shop is growing.
Steps
- Log in at app.bigcartel.com.
- Go to Dashboard.
- Hover over areas of the graph to view a breakdown of visitors, orders, conversion rate, and revenue for that time period.
- Adjust the timeframe below the graph to take a shorter or longer view of your stats. You can select All time, Last 7 days, Last 30 days, or Month to year or a Custom Range from the dropdown to get a more detailed look at how your shop is performing.